- Material recycling
- Plastic
- Paper
- Electronics
- Metals
- Batteries
- Vehicle batteries
- Hazardous waste
- Alternative raw materials
- Industry solutions
- Manufacturing
- Public sector
- End-of-life vehicles
- Automotive
- Retail
- Process industry
- Infrastructure
- Recycling services
- Waste collection and recycling
- Total waste management
- Outsourcing
- Demolition
- Reuse
- Confidential services
- Insights & Inspiration
- Guides & Articles
- Videos
- Events
Article 3 of 5 - how to seize the potential of a PaaS business model
This is the third article in our five-part series on how to seize the potential of a PaaS model in your business context. Here you can find the first and second part. In our previous article regarding Product-as-a-Service, we walked you through a step-by-step guide to develop your value proposition.
Let’s imagine you have now thought of a perfect Product-as-a-Service offering.
The offering removes the hassles of product ownership for your customers, such as storage costs and the risk of product failure. Moreover, the experience of obtaining, using, and returning the product is well-designed with your customer's needs in mind. Now comes the tricky part. How do you make it seem financially attractive?
The challenge of underestimated total cost of ownership
The total cost of ownership is an estimate that helps businesses and customers determine the total cost of a product over its entire lifetime. It includes costs related to purchasing, using, and disposing of a product. The responsibility for costs that make up the total cost of ownership (TCO) will look different in a Product-as-a-Service business model than in a business model based on product sales. In practice, this translates to costs traditionally carried by the customer (such as ownership or maintenance costs) becoming the responsibility of the providing business. A visualization of this is found in the graph below.
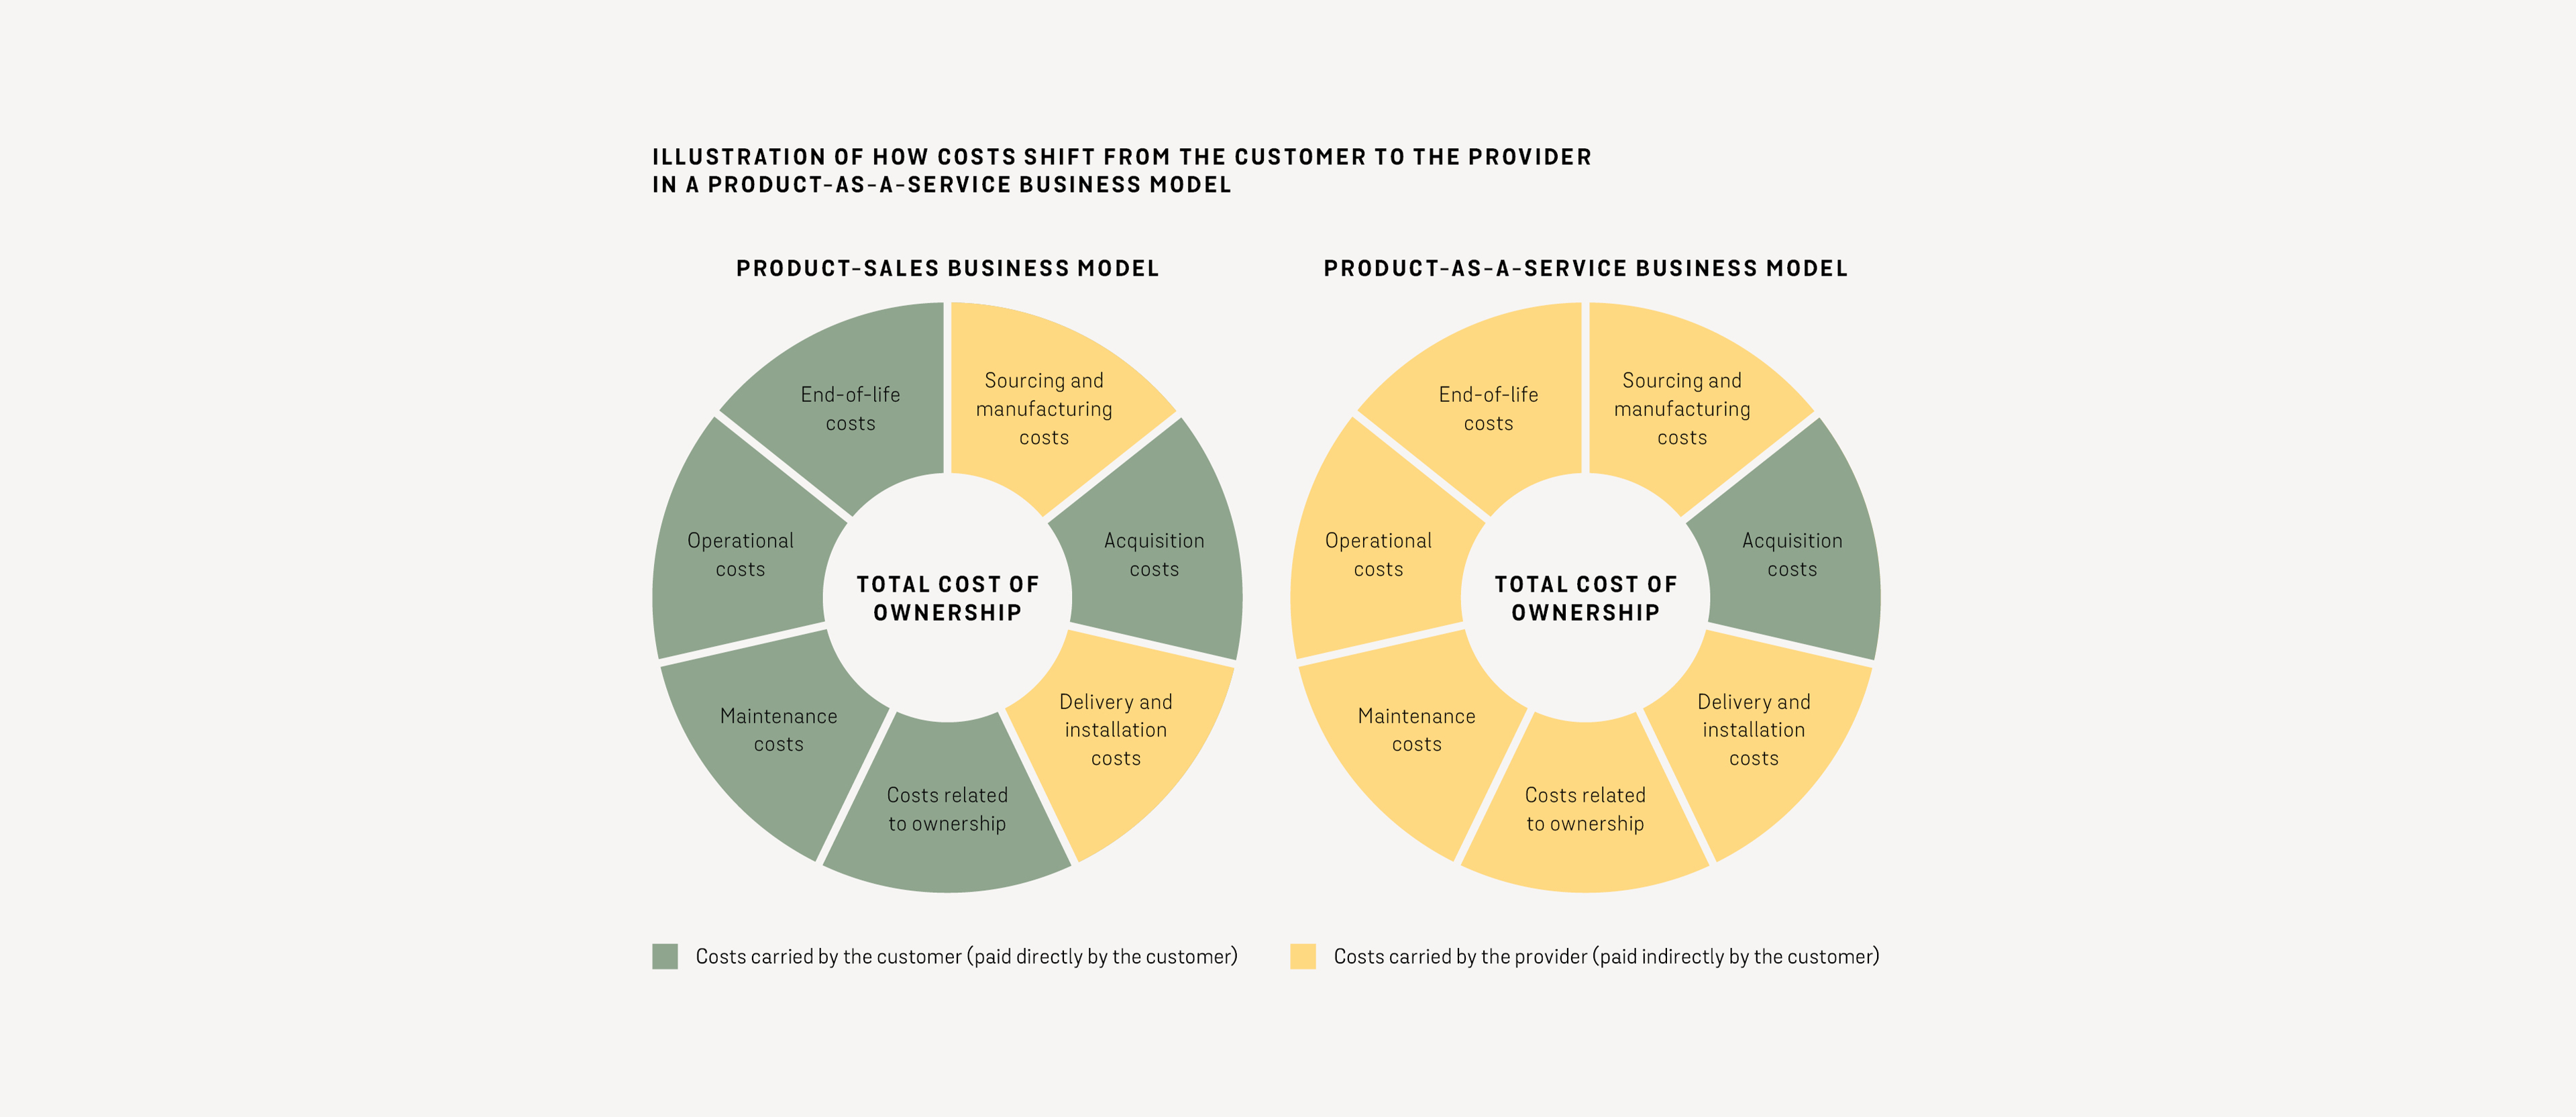
This shift in responsibility is a key reason why PaaS incentivizes circular economy practices. Suddenly, it makes financial sense for a business to promote high utilization of products, reduce unnecessary consumption, and invest in operational efficiency – rather than increasing the number of sold products.
But it can also make sales more challenging.
For customers, the perception of what a product will cost or how much could be saved are key factors when making a purchase decision. At the same time, customers (the B2C segment in particular) have been found to significantly underestimate the total cost of product ownership, such as costs associated with use, maintenance, or depreciation. For example, a study in Germany found that people, on average, underestimate the cost of car ownership by ≈ 52% or ≈240 EUR/month. This phenomenon of underestimating the TCO can cause the price of a PaaS offering to appear artificially high compared to a product sales offering.
Overcoming the pricing barrier of PaaS
A critical step towards positioning your PaaS offering as financially attractive is to understand your customers' TCO. There are many costs customers do not pay upfront when buying a product. Comparing ONLY the purchasing cost of a product with gaining the same function through PaaS is therefore like comparing apples and oranges.
Thus, we want to understand and estimate the TCO for your customer in two scenarios:
- When choosing product ownership (or any other competing model) and
- When choosing your PaaS offering
The costs included should preferably cover your customer’s costs over the whole lifecycle – from acquisition to secondary sales or End-of-Life. It is also good to think outside the box. The cost of product failure is one example that can lead to additional costs such as reduced production or productivity.
Including clear and fact-based information about costs and savings helps customers understand your value proposition. It is also a great tool for stress-testing the pricing of your PaaS offering.
To help you calculate your customer’s TCO, we have developed a spreadsheet model (link below) which gives you an overview of your customer’s annual and accumulated costs for product ownership and if applicable, for your PaaS offering. All you need to get started is an estimate of your customer’s costs.
Once you have finished the analysis, we recommend that you verify your findings together with your customer to ensure your results are representative.
An example of the output is found below.
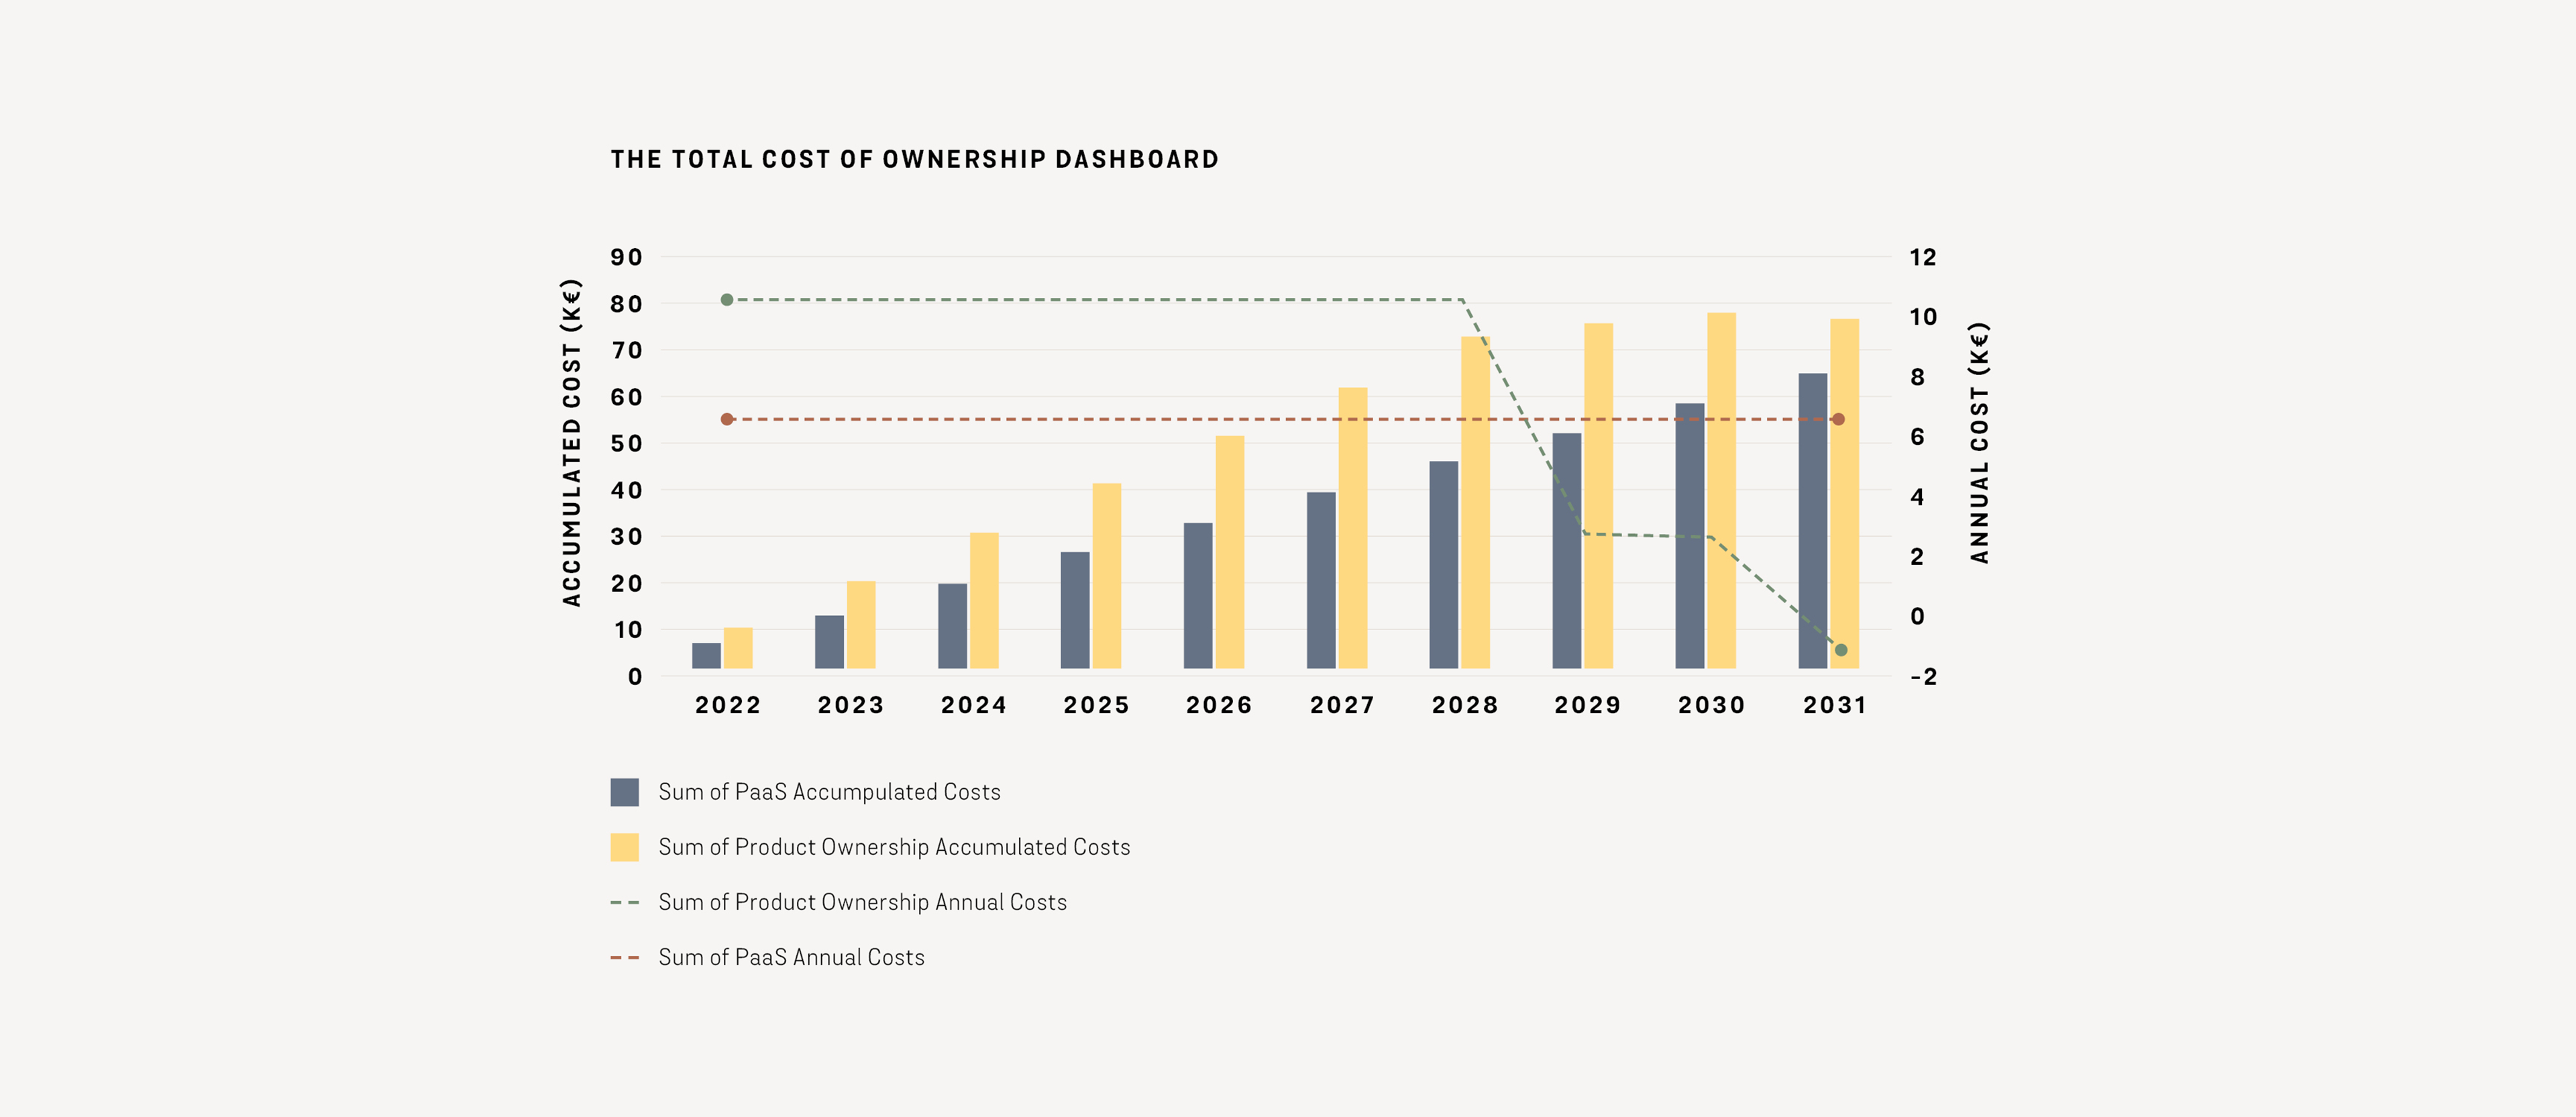
Explanation of TCO dashboard
The graph shows a TCO calculation comparing PaaS and product ownership for a passenger car over 10 years. The left axis shows the accumulated cost represented by the bars and the right axis shows the annual cost represented by the dotted lines in the chart. The PaaS has a predictable and stable annual cost over the years with little to no variations. Product ownership has more unpredictable and rising costs over time (ie, maintenance and error costs). In this example, the payment period is seven years. Therefore, annual costs increase initially, then drop to a lower level for two years followed by the final year when the car is resold and therefore has a negative annual cost (due to the car’s remaining value). In this example, PaaS has a lower total cost than product ownership, however, product ownership is cheaper during the three final years.
Share article